Good afternoon, and good morning. And Good evening, everyone, we’re gonna sell pretty soon I wanted to give you a heads up, we’ll be willing to give you a couple extra minutes just to make sure that we have as many folks as we can have. But do not worry, we shouldn’t be starting in two minutes. Thank you. All right, maybe in the interest of time, and to be respectful, respectful of all of you that join early or right on time, I want to get started a little bit. Welcome, everyone to our velluto Weekly Webinar.
Today, what we’re going to be doing is mostly use evaluation we did recently publicly of the German retailer LD, and use that opportunity to walk you through all the different steps that the platform can perform and how we arrived in literally minutes at performing that valuation. So today, I’ll be sharing with you a little bit about wt co as a company about the platform. But really, I want to spend most of the time in getting into the nitty gritty of how did we do that valuation? How could you do evaluations such as the one that we’re going to share, and eventually save some time for q&a, any comments, anything like that, as well. So without further ado, let’s get started.
My name is Mathieu Guerville. I am the value Beco team actually joined early last year and based in the US where the company has expanded tremendously, and is one of the nearly 30 countries where we have a presence. But historically velluto has actually started in Vienna, Austria. And it boils down to a need that was identified in about four years ago, in solving the pain that is doing a business valuation, our founders adhered to sentence business valuation is more out than science, and sort of from doing it themselves, but also hearing that sentence over and over again, they realized that they disagreed with it, they realized that really, when it comes down to it, a valuation is actually a little bit like a craft. It’s somewhat of a hybrid between art and science. And there was a better way to potentially do them at scale, with quality, but yet speed and accuracy at the same time. So between that realization, and the understanding of the market for valuation, and its evolution, which you can see on the right hand side, more and more financial data being available, spreadsheets, not being able to cope with that amount of data, robotic process automation, or RPA, becoming more and more widespread in other functions of Finance. And essentially, all the older macro trends, River Delta, remote work, collaboration, etc. All of this led to the creation of ldquo. And its launch at the end of 2017. Today, we serve about 150 customers in 26 countries. I feel like we need to update this slide almost every day.
I think as of yesterday, we are in South Africa as well. So make that 27 or 28 countries. The goal is for tomorrow to be the global standard and how people devaluation, we have a lot of ways to go. There are 1000s of professionals such as yourselves, that perform valuations every week, every month every year. And so we want to make sure that whoever needs to gain that productivity and whoever needs to get the data edge, we can end up in your hands. And so there’s a lot of room for us to improve there. I’ll go pretty quickly. But the foundation of LED go is really around the idea that while we want to leverage technology for what it’s good for saving time, yielding productivity, efficiency and accuracy, we want to make sure it never takes away from usability as professional service person to exert your opinion to exert you. Alright, so back at it. I think I’ve bored you enough with PowerPoint slides, it’s probably time we move on into the platform. Just again, some of the big names that trust us right now, some of the largest accounting and audit networks are working with us. And we hope really that not only from a global perspective, reaching into new markets, geographically speaking, but also a new use cases, we recently started adding venture capital firms and private equity firms joining us as well. And if any of you are in that situation where you do not represent a typical use case of valuation, we would love to hear from you.
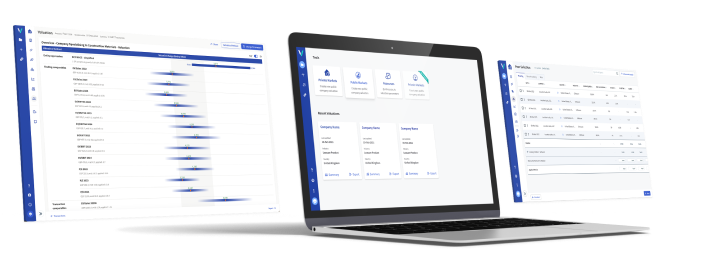
So by all means, please get in touch with us. What we’ll do now is actually go directly into the value Ico app. As you may have gathered from the discussion earlier, this is obviously a tool that is available in the browser. It doesn’t require you to download anything. And what that does for you is it really enables you to always work on the most recent version. We make updates to the data obviously, but also to some of the features and functionality on a regular recurring basis. And so by delivering the service as a cloud based application, you are getting sort of the best of both worlds with regard to 24 seven support, yet at the same time. In the flexibility, if something were riddled with the calculation, and I’ll do it on our back end, and you, you can still do it really on any sort of device, including mobile devices. Now, when you land here we are on the landing page of a signed user in Valutico. Now, obviously, my homepage is going to look a little bit different from yours. Granted, that I have a few additional perks, such as the impairment testing module, which is currently in beta, please feel free to reach out to us if you’re interested in that it’s currently not available publicly. And it’s something else I want to call your attention to, if some of you in the audience actually advisors on transactions and are looking to grow your business, we have a feature right here, where you can actually collect interest from business owners that have contacted us to get a preliminary evaluation and a quick opinion about how much they could hope to garner from a transaction. And so you can see right now, my profile being set global, I see quite a lot of them.
But this is a perspective on what we call my voluto. And the amount of small business owners and actually some of them not quite that small, and that I’ve reached out and are looking to be helped in a transaction. Now back to the main screen, you’ll notice we have three main modules, and I’ll walk through them in right to left folder for reasons that will become apparent in a second. Our most commonly used module is this private market one right here on the left, and this is the one we will use to value LD as we did in that LinkedIn post that probably attracted you here. That module is the more robust one that contains all the features and all of the inputs that you would want to do in the case of a private company, where you as an expert, and potentially as a provider, to that company will have all that data. The module in the middle of my screen right here, right now in capital nuggets, is actually one that is extremely helpful for investment managers, only if you’re doing just a little bit of strategic research. And you want to see a valuation perspective on any publicly traded company, anywhere in the world. So our data set has about 50,000 listed companies.
Obviously, that number moves every day with IPOs, mergers and other things like that. But this is a way and we’ll do one in a second to what literally be one click away from seeing how a public company could be assessed. And then finally, we’ll play with that a little bit, which is that the logical resource module, which is a very quick glance at some key indicators, such as trading multiples for certain industries, risk free rates in various countries, etc, etc. And so in this case, what I’m going to do, and let’s say I’m in the US, and I want to see about Canada, are looking to expand there, for instance, this resource module will give me access. Hey, hi. So what we have here in add resource module is essentially a very quick way to get that information in one centralized location. I know most of you deal with these information, things like your risk free rate, the corporate tax rate, things like that, and perhaps you depend on multiple sources to find out information.
This is our way of making that easier for you. Just one quick glance, quick glance. Now we break down that inflammation by country. And that’s obviously something that can be in some cases, pushing you towards navigation towards you know, looking at different countries one after the other. But overall, you’ll find that lots of information that is here will be actually transcribed when it’s specific to your project, you will find that information woven in directly your workflow. Not a trading tab right here is actually again, for Canada in this particular case, looking at a trading multiples of public listed companies, across different industries. And so this is something that you will again, see in our actual valuation workflow, you’ll see where that data is coming in, and how it actually becomes directly relevant to any particular project you’re doing. And then finally, we have here the transaction tab, which likewise will be something that will be funneled back into the application. And so if you just wanted a quick overview of what are roughly the going prices, if you will, in terms of multiples in one particular country, that is where you will find out that it’s in the resource tab. Now let’s head back home to our main dashboard. And what I think we could do is I’ll walk you through how to create a private valuation. And more importantly, I will reopen the Aldi project that I did for the original blog post. And we will walk through every one of the assumptions that we made and actually deconstruct the, the options that were given to me and see kind of how we arrived at it. In a case where you don’t work off an existing valuation like we will in a second, you would actually create a project very simply right here by giving it a shot. company name. So acne, the classic, casual name for American companies, you would want to indicate the location of the company. And that obviously will actually affect what we saw in the resource tab, the peers that we were recommend the industry, multiples, etc, will be based mostly on the region in which you’re doing that valuation.
But there’s flexibility, you can always change some of those things going forward, that from an industry perspective, you have two options really available to you, you can either search it. And so here machinery, and you can see all the different subcategories of machinery for instance. Or you can actually navigate using two very commonly use taxonomies, the neci and the nacsw. And so really up to you, we know some folks have a degree of comfort and can recite their nacsw codes by help. If you prefer to just do a simple query and search by keyword, you obviously have that option radio, then, the only final thing we will ask you to do to create a new project is to allocate a currency obviously, and then the annual revenue estimates for the company you’re trying to value. Everything else is optional. Beyond that, know, when you’re looking at the two fields that are below that, they’re both optional. What they do is that in the case of similar public company, and you can see actually right there, since we’re going to do LD, let’s try to find a similar company in a retail space. This is to anchor our pa recommendation engine, and to make sure that we see the recommendation with at least one name that you are very comfortable with. And that way, when the engine actually recommends 1215 or 20 additional peers, it is going to be grounded in that decision you made right here. And then finally, for some folks at some time may need to do valuations that are backdated, maybe for tax purposes, or impairment testing for that matter. This is something that we have enabled where you can actually choose the date at which the valuation will be anchored to and obviously that changes some things regard to trading multiples, etc, etc. Now, because obviously, we’ve done that valuation already for LD, I’m going to show you how you can really recover some of your prior work here. And you can see some of the many evaluations that I’ve done over time.
Aldi is right here conveniently with a starting with an A, you don’t have to go to file. And you can have that information right there that that valuation was originally done on March 1 2021. When I click on this, it will take us all the way to the end result. And I will navigate us back as if we were creating that valuation from scratch today. So if you’ve read that post and remade, you already know sort of our findings and where we recommended devalue land. So instead, what we’ll do is we’ll navigate back to essentially that workflow, you see up top, where we start with the company information, which we just entered. And the first real step of work is going to be what we call the qualitative assessment. So let’s go into it and get a qualitative assessment done on LD. Now Being that this is a case where we already did devaluation, you’ll see all of those weights have already been adjusted, I want to walk you through what they mean, and why we’ve made some decisions that we’ve made. so far. The intent, I will zoom out a little bit, by the way, so you can see a little bit more, the intent of this practice is really visible at the bottom of my screen right here, we want to apply a certain cost of equity premium, according to our cost of capital method, which is the cap m model. And we want to apply a discount to trading multiple and when we’re going to compare Aldi, to otter publicly listed companies. And both of those things are a result of the overall risk factor that we assigned to the company. So every leverage that you find here, and they’re neatly grouped by topics, whether it’s General, whether it’s about the market, with the management team, et cetera, et cetera, every one of those factor actually plays a role. And you can see how much of a role it is on the right hand side, we have the weight of these parameters. Every one of those factors plays a role into moving their risk factor. So in this case, LD is obviously a sizable it is private, but it is sizable.
So I updated when I did this evaluation, to go from a neutral ranking of three, all the way to ranking it as a large company. When I do that you should see up here, as well as at the bottom, how that affects the score right here. And this is obviously you know, reflective of a discount, full size or discount for lack of marketability, all those different factors that you normally sort of have a soft perspective on in your head. They’re reflected in a much more quantifiable and more embodied, documented way. So that if you have multiple folks in the firm doing that kind of work, you can see how they arrived at recommending falling cents, it goes to the equity premium of 3.1. So we haven’t really reinvented anything here. All of the factors that are listed on this page, and I’ll walk you through a few more of them are things that you as professionals are already looking at what’s new is the ability to view it all in one page to document it. And actually, to have traceability, we issue an audit trail, if I were to make a change here, that would actually be reflected in a document that shows me that on Tuesday, March 18, I made a change to this particular reading. And this was the impact to my cost of equity premium, etc, etc. So some of the factors that we take into account, obviously, things like market size, for grocery retailing, that’s obviously going to be enormous market. market growth, on the other hand, is probably less attractive than some of the other markets that are out there. And then in terms of market share, LD may be private, but they are in the top 10 largest global retailers. Therefore, I wanted to give them credit for that and rank them relatively high. When it comes to competition. This is obviously a highly cutthroat, highly competitive market. So I want it to represent that I could have frankly gone even a little bit more aggressive here. And market has really high exposure to business cycle, we know that for a fact, obviously, this category is affected quite a bit. By the economic cycles, when people have you know, higher unemployment, spend a little bit less on groceries, maybe you’re down market to different kind of retailer, etc, etc. Now, other factors that may be a little bit less obvious are going to be around the management team, not only their quality overall, but also the strength of the bench, if you will. And in that case, with a little bit of research that I did on my own, obviously, you would know that a lot better if they were your clients, and you were doing his work yourself. But I wanted to actually say that Aldi has a relatively strong bench and does not depend too much on one or two individuals.
Therefore the reliance on key persons, I marked that as relatively low on the sales front, things that all professionals use to m&a. That’s actually my background, this is always something you want to do as part of your due diligence. How much do you rely on the top customers is 80% of your revenue coming from 20% of the customers? Oh, is that a little bit more of a healthier customer base overall. And so this is what I wanted to reflect right here, customer lock in, I think there is very little little lock in or even loyalty necessarily in the grocery market. That’s why I wanted to reflect that as very low. So overall, the intent here was to try to represent our understanding of how LD operates. And by modifying those factors radio to eventually present a credible perspective on the overall risk factor which yield eventually a credible cost of equity premium, as well as discount to trading multiple. If you have any questions, by the way, feel free to use the q&a function. But I believe there’s also a chat function that is activated, and so feel free to put it at any point in time, I will try to keep an eye on it.
Obviously, I’m a little bit distracted by keeping an eye on the main screen, but don’t hesitate. When you’re done with the quality of assessment, you can follow up here again, we’re going to move into the peer selection phase. And so in the selection phase, if you recall, I had actually used Kroger as an example of a company to preload in our data set. And that work was obviously done a couple weeks ago. But the set of peers does not evolve that much, if at all. What I did at the time, was really make sure that I curated a somewhat global because Aldi is a global company, I didn’t want to over represent, let’s say Germany, where Aldi is from.
And I wanted to curate a somewhat global representation of retailers that have a similar profile toAldi. So retailers that I think were initially included. And I removed were things like the Home Depot, which is a hardware store in the US and others that I was less familiar with. But really what you do here, this is the end result that I arrived at. But in the process of doing that, what you would want to do is look at the set that we provide. And based on your own understanding of it, as well as the little hints that we can give you here in terms of description, is to decide which companies to add or remove. And so let’s say that in, in this case, in particular, we’d like to remove this Belgian company, for whatever reason, you would use that menu right here and say I wish to remove this company. When you do that, especially as you remove more than one, what you end up doing is you curate a set of peers that is more relevant to your particular target.
And therefore the median that we extract from that set of peers is going to be hyper targeted to the company you’re trying to evaluate. And so in this case, you can see that the median of the various multiples we provide right here is readily available. And here you’ll find that number that we calculated in the quality of assessment. Our work in a qualitative assessment recommended that we have Apply in 19% discount to trading multiple. So that is why the platform is doing right here. If I decided for some reason that maybe for revenue multiples, I wanted to apply a less steep discount, I am still totally empowered to do that myself. And I can help code a lesser number right here in terms of the discount, oh, health code, an actual number by hand right here and say, you know, I would like to just have a point five times sales multiple right here. Now, interestingly enough, LD is a pretty easy to box and sort of company. In other cases, you may have a company that sort of fits between two buckets is it a digital entertainment company or software company for thinking of, I don’t know, Spotify, for instance. And so what you can do here is use that little plus sign and add an additional, an additional industry.
So let’s see if there’s anything else that we could look at that might make some sense here. And let’s let’s just go with food products, maybe just just in case, to see maybe Aldi should look to do vertical integration instead of actually being maybe producing more white label. And so what I view now is three perspectives. I have my perspective on the median of the peers that I selected across Evie over sales, Evie over EBITDA, EBIT, and net income.
And I have the perspective of what are the trading multiples for the industry overall, as well as the auto industry that I added. And from there, I can really decide what I want to do. Now I showed you how to remove a pier, I showed you what we do have it here dado. Now let’s look at how we can add some. So let’s say I want to look at companies, I’ll go straight into the sub industry actually, and see if I can find some additional retailers, food and staples, retailing. And maybe I feel like I have not really represented the Asian market. I’m not actually quite sure if LD is present in Asia. But we’ll see this is the fun of doing a live valuation without a safety net. And so let’s see what we’re finding. I looked for publicly listed companies in the food and staples retailing in Japan, just you can see you get a perspective in case alldis in those markets. And I find 106 companies, I can view the list of results right here. And it looks like Lawson, which is I believe a Australian company, maybe also listed in Japan, so maybe I will just include them. Now once I’ve added a company, well, if I look at just the set that was already there, I can also do a little bit of a deep dive, if I wanted to look at calls also an Australian company and see where is this data coming from? The lirico is very transparent about where our data is coming from, and what date most specifically and how we did every single calculation. Some of our clients that are using workflow, IRS compliance or even FCA compliant sort of work, want to make sure that in the output that they provide, there is a full traceability of how every number has been calculated. And so that’s what we provide right here, you’ll find the method that we use, obviously, multiples are very simple decisions that we make. But nevertheless, we want to be very transparent about how we arrived at this. If I wanted to also perhaps make a more educated guess, or Oh, a more educated selection, when it comes to my beta be delivered or unlevered. The the levered aspects will come into play on the later stages when we decide to tweak maybe the tax rates and things like that. But I also have the ability to do that either at the scale of the entire set of fears and look at my beta right here, including the median for the various industries that selected where my peers are located. And where we have selected to position our sales. Well, I could look at the beta at the perspective of one single company and see the beta calculation for them which we use a rolling five year monthly average to perform By the way, that data is also downloadable, if you wish to do some analysis on you. Now, final thing I usually do is before I move on from a set of peers, you know, they look good at first glance, but maybe something is going on there that I would want to make sure I catch. And so usually I go into that benchmarking tab right here.
And what the benchmarking tab will do is visually show me the rate of growth and some measures of profitability for all of these companies across different time horizons. So I can see some of the momentum that’s going on. And I could potentially decide to remove some companies Metro here I see as add tremendous growth over the past few years. But you know, we’re still in low double digits, we’re not looking at something like 50% growth or maybe they made an acquisition and the multiple might be thrown off a little bit. So I opted to keep them in in some cases.
I do a lot of those demos on software companies. And you’ll find really very, very wide ranges with profitability that are extremely negative, as well as sales growth that you know, in double, triple or quadruple digits percentage wise. And that gets a little bit more cumbersome and you want to make sure that you can spot any potential outliers. And that way make that decision. For instance, in this case, let’s say a company has invested a lot in capex really stands out, you can see the median is 2.6. These guys, Lawson is actually more than doubling that, I may actually decide to remove them, just on the basis of that they may not seem like a perfectly good match. Once I’ve done that, I’m sure you can guess where we’re going next, if you are following along the top of my screen, and so we’ll move on to financial projections. Now when we get to financial projections, and this was actually a little bit of a complicated one given at Aldi, albeit as big as they are, provides very, very little information about what to do in terms of financial performance. And so we had to use the Veliko estimates, the lirico estimates are perspective on creating a simplified p&l, cash flow statement and balance sheet, essentially all of the key items that you need to do a DCF by extrapolating the data from the peers and the analyst consensus estimates that come with them. So in reality, the only number that I entered initially, when I made this Aldi valuation was this right here 120 billion euros of revenue, every single number after that was created automatically by value to go by simply using the rate of growth of its peers. And so in that case, you can see that for 2021, we’re estimating that the company will get to about 120.7. And I can go to the benchmarking tab right here and see where that comes from. It comes from my little sales tab right here, the median estimated sales growth of my peer group. Now, for the sake of flexibility, we allow you to change that however you see fit, if you think Aldi is not being affected as much as its peers, and you want to say maybe give it the one full percent right here, you can actually do that. When I do that, you’ll notice that numbers switch from being green, which is an extrapolation from builder to go into being blue, which is data you’ve entered yourself. In this particular case, we had done a little bit of research prior to developing the company and found out that we estimate the gross margin to be about 3%. And so I actually had played with the numbers. This is where you’ll see a lot of blue on these lines to reflect the EBITDA, the EBIT and net income that will be consistent are these credible with a 3% gross margin case? No, when I said 3% gross margin case, I use the word case I could really say a scenario.
And this is actually what we did is we represented two different scenarios in which to value LD. One is where we aggressively by hand fed into the model some new assumptions representing what a 3% gross margin might look like. And another one was actually just you take always the analyst consensus estimates and stick to those numbers. And so if I go back to that other scenario, you can create unlimited scenarios. By the way, maybe you will doing a scenario of management case versus synergy case in the case of an acquisition. Or maybe you’re doing a different scenario in terms of different growth estimates for a particular company that are not tied to an acquisition or something like this. But you have the ability just at the click of a button, as I just did, to switch between scenarios. And so this is my peer case out of March 9 2021. And you can see here, that actually, my epidemiology is quite a bit higher than the one I had in my other case, they will we see yield different valuations. And so you have to make sure we documented everywhere, that when you arrive into valuation, just check which case you’ll actually be valuing at the moment. Now, a couple other nifty aspects of this platform when it comes to the financial projections, not only do we seed everything with the peer data and let you adjust as you wish, and most of the adjustments can be held coded as a value such as you know the ML in billions of euros right here, we’ll have coded as a percentage of mlj.
It was our rate of growth, full revenue. really making is flexible to represent your assumptions however you like to build them. You can do a couple of other things. One is adjust the length of your forecast. In the US especially in industries like software, we tend to do pretty short forecasts, three to five years gain, maybe capital intensive industries, you would want to do longer forecasts, five, 710 years. We give you that flexibility. You’re right here again at the click of a button. As I add those forecasts in year 2026, and 2027, just showed up, you can see just like that, by magic, everything is already prefilled. For you, again, based on assumptions that aren’t grounded in market data, this is not it simple straight line estimate, wherever we can, we use actual market data to see that information. Couple other things you can do before we move on, is download that data and work on it. And whatever tool you’re most comfortable with, whether it’s Google Sheets to collaborate with many older folks, whether it’s Excel, or whatever else you’re using, you can do that very easily, and then eventually re upload whatever work you’ve done, and led code will ingest that information back and represent it as a new scenario, essentially. So very simple right there.
And then eventually, once you’re comfortable with your assumptions, I always recommend checking the validation tab, which is sort of like the plausibility check shows you various different dimensions or derivative of the numbers that you’ve entered as a way to see if anything really seems outlandish. For instance, right here, I think I played with the capex assumptions. But nothing strikes out as extremely out of the ordinary. But in some cases, you’ll see a finger right here, that will spike a little bit, maybe because of an analyst consensus estimate that drops in the algae or fill a particular pier or something, this is your perfect age to spot those sort of bumps in your model, and smooth them out. Now, if you’re doing a project that’s obviously a little bit more involved, and you are working directly with the client, this is not like a pitch meeting, you have actual data of a lot of their operations, and maybe a cap structure, and a cap table and capital structure, you can make some adjustments in there as well. Here we have pension obligations that were not represented, we probably could have added some I don’t have the assumptions of the top of my head, but I’m sure I’ll do some pension obligations, I could really add any older sort of maybe things that I would want to do, maybe I want to write an ESL plan, or something, I guess. And eventually that gets reflected into the net, that bridge that we’ll see in a couple pages. I don’t see any q&a or any chat, comments.
So I will keep plowing forward. But don’t be shy, feel free to interrupt me at any point. And I will be happy to take your questions. I know this is a lot to digest in very little time. As I click on Next, we’re obviously headed to to transaction time. Again, if you’re following up there, this should be pretty self evident. And the transaction tab will work in a manner that’s very similar, you should feel very comfortable with by now already, because we spent enough time on the pier selections at the dynamics of the user interface is very, very similar. Valutico makes some recommendations and will give you 10 1520 different transactions that the platform believes are relevant. And that seems pretty much on point right here. Lots of acquisitions. In the past, maybe I would want to remove some of the older ones in the food and staples, retailing. And lucky for us lots of great information here, lots of multiples that aren’t available, etc, etc. The mechanics from here, exactly like the peers, maybe I want to remove this transaction because it is now almost 13 years old. So this is actually perhaps a little bit too old to be particularly helpful.
This one as well. And so the removing feature extremely simple. If I wanted to add some transactions, this is something that’s not done very frequently, because you don’t often know by the name of a transaction by now, but you could do a simple search right here. Or more often, what you’ll want to do is do a filtered search. And what you’ll notice here is actually a feature that is yet to make it but will soon appear on the pier transactions on the pure selection tab is a full text search. And so right here, you can see that we have about 800,000 precedent transactions that are available, including over 150,000 I believe, where multiples available. And what you can do is try to narrow it down quite a bit. And so if I’m looking at transaction in the food and staples, retailing and let’s say I want to look only the past five years, so five years would be 2016 mid March.
And I’m going to look at a set that is about 300 transactions. And now if I wanted to narrow down and maybe look at convenience, maybe Aldi is looking to expand into the convenience store. And so I’m going to add the keyword convenience here. And just like that, we narrowed down our search from 300 plus results to just 87. Now maybe I want to remove anything that was a minority interest taken now 50% 51% and above. And maybe you also want to remove deals that would be too small less than 100 million And just like that, we’ve narrowed down to 14 transactions that could be quite interesting, right there. So I am not, I believe familiar with most of these. But this one is relatively sizable, it is in the US, and it is in the right category. So I’m going to edit, we’re looking at performance food group. And then once I’ve added it, I can do a quick Double, double take and make sure that I’m actually really comfortable with that transaction by clicking on the details tab. And right here, I will find a snippet of description of that bathroom transaction. And that way, I can read a little bit more through it and figure out do I actually want to include it is it really a relevant transaction for my for my particular project, eventually, once you build a list of transaction that you’re comfortable with the object is obviously the same is to find the multiple that you are comfortable with. In this case, we provide you the median, we suggest a discount, or premium as the case may be. And then we let you decide really when you will do. And so let’s just go here, manually rounding it up, 2.5, maybe doing a slight discount of 5% on the EBITDA, multiple 5% on this, and not sure why we were at this original various discount, but given an Aldi is, I believe less profitable than its peers at your discount status.
I want to apply this deeper discount right here. Once I’m comfortable here, a quick glance, Oh, you know what, I happen to work in the retail industry. I don’t but let’s pretend. And I knew if a custom transaction, I know if a transaction that is not publicly available.
And so what you do here with the simple mechanism is if you have a particular expertise, we have a lot of clients that say, you know, I do a lot of healthcare acquisition. And so I have a lot of data from my industry that nobody else has that cap IQ doesn’t that pitchbook doesn’t, I want to be able to import that in, this is how you would do that, you would add the information about a deal that you know, and that way, obviously, the more I add the oil, move the median, and also eventually you obviously appear in my report, and I can share with my clients. And so we’ve done it now that we have completed that final step, the bulk of our work is done, there will be a little bit of fine tuning that’s available to us. But really, by and large, the the work has been finished. And we’re going to get to evaluation. Now this valuation is because I fiddled with the numbers a little bit might look a little bit odd.
But directionally speaking, we should be looking pretty good, especially when it comes to the multiples based approach I played with the p&l a little bit too much, especially giving it giving LD a lot of credit for our profit margins were above the industry averages, and therefore my income based approaches DCF and even the equity based approach are going to be relatively rich. But when you look at the training comps, we have a very nice, very narrow range right there that you could feel very comfortable is likely where the company value would net out if they were to were pumped to go public. None of I’ve done that. I have my ranch right here. And I can actually go and dive a little bit more into each of those methods and see graphically in some cases or in tabular fashion in otters. How exactly do we arrive at those estimates. So right here is my net that bridge, which I added zero for the sub that we WC show up if we add created an additional item on that table. Right here is the full breakdown. And I will zoom in a little bit I was zooming out earlier so we can see everything that may come closer here. Here’s a full breakdown of how we arrived at our walk of 4.5%, which is really low. But upon verification, it is common in the grocery and around high volume retail industry to have pretty low wax. And so you can see all the different assumptions that we made. And by the way, if there’s any of them that you don’t like, you’re just one click away from adjusting them right here. Now for the sake of discussion, we’ll bypass that and just assume that we’re pretty comfortable with this, including our gearing, I think the gearing is right here. I’ll target that ratio.
And so this is a feature People often ask about, then we can see sort of the full build out of the cash flows that yield our DCF in Turning the sensitivity table obviously, because of our very little work, you can see here we have this number right here, it’s just a limitation of the growth model that’s used by literally everyone in the industry, when you come to very, very low wax, that overlap, innocence even table with a perpetual growth rate. And if there’s a method that I don’t particularly like, in this case, actually, I kind of want to hide the DCF. Because we have so little information about how well LD is doing, we have so little information about how much of their cash they’re spending in capex and things like this, I may actually opt to hide my DCF valuation. And when I do that, it’s not simply going to remove it visually, it would, if I had not held coded or random myself, it would actually restrict the range a little bit and give you that little narrow sort of field that you usually you know, obviously, you want to go to a client’s with something like plus or minus 10, or 15%. If I look at other methods, obviously, going further down the table, I’ll see old traditional methods of representing the information, you’re trading multiple, as a nice little histogram charts.
And then our transactions are going to be represented right here. And all of this is obviously something that you could click on to see more details, etc, etc. When you’re happy with the results, and if you feel like you don’t necessarily have to do a lot of adjustments with the various parameters around right here, you could actually do two things, you could stop right here at this web version and share this.
This is actually what we did, those of you who consulted the blog post and read through it, you may have seen a link that will lead you on this page. This is exactly how you would accomplish that you would copy that link right here, decide to make the valuation public. And then if you change your mind and want to do some more work on it, then you don’t want anyone to access it while you’re working on it, you turn it back to private right here. The one thing to note we also disclose right here we’re looking at a pure case, if you remember, I had two different scenarios. If I wanted to show the 3% gross margin case that we created, I would just go back to financial projections, or reload that scenario. And you would just be one click away from recreating one. So that’s one option. The other option is going to be to do an expo if you work with clients, and you would rather send them a Word document or PowerPoint, rather than sending them to a web view such as this, you can do that as well, I’ll show you in a second. One final thing I wanted to show you on that page was something that actually is a huge time saver, whether you are in private equity or doing lbos occasionally, or you just want to compare, just to get a perspective on what other bidders potentially you could be seeing. We actually provide an LBO model. And you’ll see it at the bottom of my page, the LBO model comes with its own set of parameters, which I can address right here in terms of the targeted leverage, as well as the exit and entry multiples.
And so this is very flexible. This is something you only do on that page, we don’t element, we don’t let you ask you as you build a separate financial projection, we only manipulate from this simple parameters right here.
So from an external perspective, we offer multiple languages, basically every language that our current clients are speaking, and we’d love to add a new language if we can add a new client that requires it. But what I did is I created already a PowerPoint version, I will share my oral desktop in order to do that. And I will show you kind of what the what the end result looks like. Actually, let me share my PowerPoint. Alright. So the outcome that you have here is a document that would actually be branded to your colors, if you join us and provide us with your logo, etc. you would have your information represented in there two colors that you prefer to logo that you prefer. And then one thing to point out is that I know sometimes, you know, before going to a meeting, you need to make a quick adjustment, or remove a peer because it might offend a plant or maybe change a number around something. Everything that’s in there is actually editable. None of this is pasted as an image. And so if you wanted to not show accounts payable for whatever reason, or if you wanted to potentially make some adjustments here and remove that sensitivity table will make it bigger or smaller, you can actually do that. Again, everything is easily editable. And we also provide in a format that’s even more customizable, a word Expo. And so in the word Expo, you can have as many placeholders as you’d like.
Likewise, things are editable. And we allow you to essentially tell us for instance, I would like to have an old child. We don’t provide the old child that we provide the placeholder. That way the analyst or whoever is doing the work on your team. always follows a particular format and weak producing output that flows with how you normally work. So that’s the gist of what I wanted to show you today. I will go back to the platform, and I will pay close attention to the chat and the q&a section.
Let’s go back to the valuation screen, it’s going to sing in the export tab. Any questions, comments? See, none of the chats will now none of the q&a was done here. Let me see. I believe we may have. All right, well, I’ll show you a couple more things. And since we have more time, we’re essentially done with the demonstration, I’ll show you a couple of additional things if you have time to stick around. A couple of things that are nice, right here, you have the support feature built in intercom. And so what this allows you to do is to ask any questions or you as you’re using the platform, you can essentially look for answers that have already been provided. So if you’d like an FAQ aspect, you could schedule a demo from that tab. Or you could actually send us a send a message to our support team. We have support team in North America and in Europe. So we cover really a lot of the timezone in which you work. And we also pride ourselves in everyone on the team being not only capable of supporting you from a technology perspective, but also from a valuation perspective. And so if you have technical questions with regard to some of the methods that we’re using, etc, this is also something that you can ask via this forum. And a motor needs feature of the platform, which is something that some of our clients really love to use, is we have a means to let you provide feedback. And so if you use this little widget right here, you can actually say, I would like the LBO model to be based on it been done multiple instead of EBIT, and you submit the insight, and because we build our features based on your feedback, we will essentially aggregate all of the friend points that have been made. And our product team uses that as intelligence to make a product roadmap decision. So this is also a nice feature that our clients have your voice really matters to us. And we really want to make sure that we represent your wishes in our product roadmap. Speaking of product roadmap, I will show you a little bit of an overview right here, some of the things that are coming up, there will be some major improvements in the UI and UX coming up in the next quarter or so. But also some little invisible sort of things, the machine learning algorithm is getting better every month. And so from initially seeding with just one company like Kroger we did for Aldi, up until giving you a bigger, but also more targeted list of recommended peers. This is something that’s constantly improving the increased customizability.
This is something that’s going to show up especially in areas such as a qualitative assessment, where you’ll be able to decide how much value to assess to each of the different components of it. And then other aspects such as co product augmentation, better collaboration, beyond sharing, simply a model, doing access to API’s better data inputs, and also an ESG model that will come up for those of you that ever do environmental, social and governance factors in your evaluation.