Transcript:
Paul Resch
Good afternoon. Good morning, everybody. We will start shortly. see most of you joining right now. Thank you for bearing with us. Alexandra, are we ready? Can we start?
Alexandra Allason
I think we could start the warm welcome from a cold, snowy unfortunately, Austria, I hope that things in Brazil a little warmer. On today’s webinar, we have pool of ash who is the co founder and CEO of Politico. And we have Leonardo risotto, who is the co founder of dexis. During the course of the webinar, you will have a chance to obviously ask your questions, but I do advise that you use the q&a tool, and also the chat as well, just for when you have any thoughts during the course of this webinar. Anyway, I will leave it to you gentlemen. Best of luck, and yeah, everyone enjoys that. Thank you very much.
Paul Resch
Thank you very much, Alexander for the introduction. Leonardo. Good afternoon or good morning, I guess. How are you?
Leonardo Pansardi Grisotto
We are in the middle. Coming from morning going to afternoon.
Paul Resch
cover the whole planet.
Leonardo Pansardi Grisotto
It’s okay. Good morning, everyone. Thanks this
Paul Resch
morning also. Yeah, and good afternoon to the audience. Thank you for joining us today we have a very interesting presentation or a little discussion prepared to you will also give you a little demo of Politico itself. And throughout the presentation. We have a few polls. That should make the whole thing a bit more interactive. Let’s give this a try immediately. Now. Start with a poll. Where is everyone based? was interesting to hear that. North America, Europe, South America now catching up, I guess I’m the only one who sees the lifeboats coming in here. 50% South America now. So now it’s your corner of the world. I guess.
Leonardo Pansardi Grisotto
That will be only me. I mean that. No, no, no, we
Paul Resch
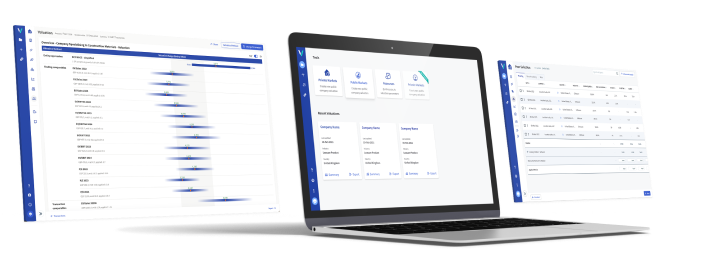
have we have quite a quite a few participants today. Oh, good. Great. Good. Shall we start? Well, maybe a little overview of what we have planned for you today. In the meantime, I will end this poll here. We’ve already had a little introduction. Maybe I’ll go ahead and introduce myself, Paul. They are one of the founders of Politico previously and mergers and acquisitions myself, like you Leonardo. So I worked at Deutsche Bank, built some of the models there that became standards, then finally decided to to venture out and do my own thing. When we started Politico about six years ago. We built it over a second three year period and then launched another three years ago. I think we actually have a slide for that. Let me jump ahead. Yes, here we go. Well, what is political, it’s an OBC evaluation platform, right? You all know the status quo. You work in spreadsheets, you work with databases, you have to collect data from various different sources, you do your analysis, and then you have to get your results to slides or some other presentable format. And this is where the new ticket comes in. With political all of that happens in one integrated and cloud based solution. So that means we typically save our clients between 30 and 50% of the time, on any given valuation. What does it mean? Well, we connect also with a lot of databases, you know, Capital IQ and a number of other world leading databases where we get our data from, actually some of the statistics here are quite outdated. We’re in over 40 countries by now. You see how fast we’re growing and this presentation is only a few weeks old. Yeah. And rapidly growing number of also of databases and connections in political They’re out. But we’d like to hear a bit more from you know why we have another slide. Apologies. Just a few examples. I think we can skip this one. Let’s Let’s jump straight to your slides, because we’d like to learn how you’re using political.
Leonardo Pansardi Grisotto
Okay. Well, I’m not from the investment banking industry. My whole life I worked with financial consulting more focused on investments or cash flow analysis and most management stuff and this kind of work. So from the, throughout the years, we’ve been required to, to process valuations and to deal with complex situations when it comes to m&a. So I decided to work only with m&a for since 2013, I think, and since from there, I developed my practice. And last year, we merged to three consulting firms here in Brazil, specifically here in the south. We are located included Chiba finite state xoxo itself, enterprise first and Leon Brava, which was my my previous firm. So we put together to eight years of experience in leading deals with national or international investors. Hello, today, we are in seven partners, we have more than seven staff, helping us to deploy not only valuations, but the whole process of mergers and acquisitions. So I’m, I’m glad to be here to talk with you a little bit,
Paul Resch
a very impressive growth story. And I can proudly say we’ve been part of some of the story recently of that story yet, but we were looking forward to, you know, accompanying you on your on further on the further growth path. And how many valuations you guys do every year? Roughly?
Leonardo Pansardi Grisotto
Well, roughly, I used to do from 12 to 20 valuations a year, we’re focused on middle market, so only private mandate is closely mandate. So sometimes when we offer biocide services, we have one client, but we need to process more than one valuation per client, you know, we need to screen the market and then value those targets to our client. So when mandate various valuation so we process on average 2025 valuations a year, okay, isn’t, isn’t
Paul Resch
worth just doing the math in my head? Think about how much time we got, we saved you guys, how many more valuations you can do now, right? If you only need half the time for it?
Leonardo Pansardi Grisotto
Yeah, the timeframe is, is incompatible. Because when we used to do that, using only spreadsheets, and that will take you we’re going to discuss this some points further, but to advance some things here. We used to take a lot of time thinking about all the rows in a spreadsheet, all the rows, now we have political helping us to speed it up. So two together, world class databases, bring it to the table. And then we have not only quality of our data of databases of inputs to serve our valuations, but a wide range of peers and transactions that we can compare in enrich our our reports to our clients.
Paul Resch
Okay, what can you describe the process before you had political What was it like then? Well, the
Unknown Speaker
process
Leonardo Pansardi Grisotto
will be if I can put some things are similar. It would be like I’m mining company, we had to mine to go to run through the market mining data from public databases or for a specific deals or a specific segments. So it’s not it’s not easy to get to gather all this information. When it comes for example, transactions. We deal most part of our time with privately held companies, which doesn’t have public data available. So it’s quite difficult to to retrieve those data. So in order to do that, we took Wix to, to establish or to, to build only a simple table, a simple spreadsheet comparing the company against its peers or against the transactions that have been made in the past. So it took, on average, three, three and a half to three, even one month of work to pull all this things together.
Paul Resch
months of work? Well, I think we I started in the fall in the meantime, to our audience here. And I think we even have one question that relates to our debt, asked people how long it typically takes them to do a valuation. So let’s see, let’s see what our audience has to say this would be interesting. Okay, but I mean, it used to take you a month, I guess political paid off relatively quickly, if I may say so.
Leonardo Pansardi Grisotto
Sure, if we sum up all the salaries and their work rates, so it will pay itself for in just a few days, I think.
Paul Resch
Got it. Right. Good. I think we need to rethink pricing. No, no, no. Thank you for that. Okay. Well, thank you for the introduction to sec. So I think with that, we’ll have a little demonstration of the platform. Right. And we continue our dialogue, while we while we run the audience through the presentation. All right. Cool. the meantime, the results of the second poll, I see it’s 5050 split some to less than 10 valuations a year, some do 11 to 30 evaluations year also, you can’t see that actually. Now you should be able to see that. Yeah. Kitt, let me switch over. And I’d like to remind the audience, if you have any questions, please just ask them on the q&a tool here. That’s the best way to ask or do it on the chat, please. Perfect that. I’m gonna ask
Leonardo Pansardi Grisotto
you something before you start the demonstration, Paul, of course,
Paul Resch
space?
Leonardo Pansardi Grisotto
How did you come with the idea of vertical?
Paul Resch
Yeah, you know, I’ve worked as an analyst in investment banking, and it’s, you know, some parts of my work, I really liked some parts I really didn’t like, and we tried to automate the parts that I didn’t like it. That was really the idea, you know, a tool by, you know, m&a professionals for investment professionals, for professionals write something to make the life easier. And that was that was really the basis for, for what became political, we built the first prototype. And after that, we simply listened to what the clients wanted. And we still do that, right. So we develop very interactive, we are very, you know, collaboratively with with our clients. Good. In the meantime, you should see the dashboards. And I think for today’s demonstration, we could do a private market valuation, that’s probably the easiest, by the way. But lutego also has features or modules where you can value a listed company. That’s capital markets. Maybe I’ll start with a very quick intro also to the resources module, that gives you valuation parameters across the world. So let’s say today, we’re doing valuation in Brazil. And it will propose risk free rates, corporate tax rate, market, risk premia, and so on. And you can choose any other country in the world should you happen to do you know, cross border work, right, a very quick way to get this kind of data. You don’t need to look for it in various different databases anymore, but you get it all from political. So this is country specific data, then we also give you multiples and pizza factors here for various different industries. And you can even filter by country. And then we do the same thing year also for transactions as the same industry classifications here. And then again, the different multiples in each in each sector in each industry. So if you need something quickly, or if you need political just to fill your own models, you can use this, but what normally people will do is they will do a private company valuation and I’ll just call this a test company. Where we do a Brazil Brazilian one, a European one. Let’s do an Austrian one. We’ve never done Austrian one, maybe Germany. Austria is too small. Nobody knows Austria. Yeah, what we could now do is we can select an industry or we could browse industries. So give you different, you know, industry classifications. Let’s find something a German, maybe a construction or machinery company. There we go. machinery. And then we provide a revenue number. Let’s say this company has 1 million in revenues. And now you see there’s also an optional input to a similar public company. The question is do we already know one company out of peer group. If not, we can just leave this empty and the system would just guess, the right peer group. And we could also provide a valuation date. Yes, basically. And I
Leonardo Pansardi Grisotto
may suggest something this particular field here is very important because it helps vertical to retrieve a more qualified information and retrieve more qualified appears. Every time we spend a little bit more time searching a peer company to put right in here. Political cost comes at brings us a much more qualitative set of peers and transaction. So it’s very important you qualify that before.
Paul Resch
Yeah, yeah, I think you’re spot on them, right? Because if we already know one company from the right, it’s very easy for us to find what’s still technically complex, right. But we can find other companies. But if you just give us the country and the revenue and the industry, you know, these industry classifications are very crude, right? So it’s, it’s harder for us to find the right people.
Leonardo Pansardi Grisotto
That’s right.
Paul Resch
Yeah. No, you’re absolutely right there. And it’s, I would agree, it’s the single best thing you can do to get a quick pickup is to already know, one company out of the peer group. And I mean, people ask me for the, you know, the strangest peer groups, right? And you wouldn’t you would be surprised for which industries you can find. Find listed peers, right. Did you know earlier now they’re even listed m&a advisors? I had no idea but in Asia, that’s the thing. Yeah.
Unknown Speaker
Is that so?
Paul Resch
That’s it’s a thing. Yeah. You find anything? Yeah. So So next time you do a valuation for suppose xo itself? I can share it.
Leonardo Pansardi Grisotto
Outside for that?
Paul Resch
Good. Well, we it’s step number two, now qualitative assessment. And you see, you know, the different steps we didn’t get to the P group, then the projections, then transactions devaluation in the export. So it’s always the same, these are always the same steps. So there’s always obviously also less room to make errors, right? Because you have sort of training wheels on when you do your valuation. Right. You can’t completely destroy evaluation with Excel spreadsheets. Obviously, that’s that’s quite easy. Yeah, and so the in this first step, I won’t spend too much time here. But obviously, what we’re doing here, obviously, but what we’re doing here is we’re asking the user to provide some qualitative inputs. But what about management quality? Right? Is there you know, outstanding management, but you know, does the company rely too much on management? Does the company rely too much on individual customers on individual distribution partners, and as you can see, if I change something here, it changes the the the overall average weight, right, and the risk factor, and that has an impact on our cost of equity premium. So this is what we add on top of cap M. And it also has an impact on the discount to trading market, we said we’re applying if you’re trying to capture the firm, specific risk here. Now very popular model module, especially with our transaction advisory clients are m&a corporate finance costs.
Leonardo Pansardi Grisotto
Yeah, especially when we are dealing with privately held companies. So we need to to impact the valuation or the numbers or the peer groups with a more specific cost of equity. So we use this qualitative assessment to do that. It’s very helpful.
Paul Resch
Have you ever tried to do it together with your clients to be done that
Leonardo Pansardi Grisotto
what we do is we set up a Google form and we send to all the partners and they respond to it individually, right we combine those those answers we get an average or median and then we bring that to here so we have a an A overall qualitative assessment assessment for all the company from starting from the views of all partners so it’s quite helpful
Paul Resch
very clever idea. Yeah. But what we found out is that this is a very engaging exercise right because these are you know these sometimes clients struggling with the more technical aspects of valuation right what is pizza what is you know, a margin, but these things here they intuitively understand right? It’s competition Yes, more competition is bad for my valuation, right? Better management quality is good for my valuation and so on. So it’s, it’s intuitively easier to understand right? And the impacts these factors have. Also, for example, when you educate your your clients about, you know, ways to increase the value of a business, right, which might also be interesting in you know, preparing a company for an exit. Good, I think, no need to spend more time here. I think the idea is clear. Let’s jump to the next step. And that’s the peer group. So let’s see what the system proposes now for our German machinery company. We see all German companies here. No surprise there. But it would only, you know, use some some other companies, foreign companies, if you know, there weren’t enough machinery companies in Germany, but in this case, not no problem. Yeah, what do we see here? Well, we see market caps, we see different multiples forward looking multiples, starting with a sales market, we’re going to the price earnings multiple, we calculate depth ratios and credit spreads, as well as Peter factors. And then of course, you can change your vehicle price, so you can work on your pickup and deducted so we could easily add a company to a peer to peer. And we think this one Austrian machinery company, one click, and a few seconds of waiting time and then the system will populate the table and add the financials for this company under IDs. There we go. already loaded. It’s really as quick as that right? No need to, you know, go into databases, calculations yourselves in annual reports and quarterly reports. All of this is done automatically. My favorite feature is the benchmarking feature here because this shows you graphically which companies are outliers. And so we see a singular technologies key here, which grows much faster, but shrank before so it’s a bit of an outlier. So I would just remove this here. And then we have one company here, that’s you know, laggy, which has very high EBIT margin, probably also be too high for a peer group, we will just remove that too. And as I said, overall, just a graphical tool to clean up your Pico because what you typically want to have is a peer group that is very similar to the company you’re valuing. Of course, you can add your own peers, I’ve showed you that but you can also filter, you know by industry, country, and basement also by keyword. So this is something we’re very excited about launching together with version three of our platform in a few weeks from now. They’re out, have I forgotten anything here on the here selection screen,
Leonardo Pansardi Grisotto
oh, the the applied metric down the table. So you can see the usage of the discount and premium above then nine minus 29%. So you have here the peer group, all the median from all the companies, the industry, median, and retrieving machinery industry. So you have this overall picture, and then you have the discount premium to the metric that you that the system is going to apply. And that you’re gonna have to understand for all those companies are bigger companies then than yours, for example. For example, we have here at Evie sales, 2021, median zero point 81 times, Evie sales. So this is for this peer group. So most of these companies are 3 billion to 224 million. So most of them are big companies. So if you’re gonna do a valuation for a middle market company or a privately held company is more company, you’re not going to use 0.1 81 times you’re going to use zero point 58 times because this this is more precise, this is
Paul Resch
behind it. It has all those risk factors that you had input in the previous step qualitative assessment, so only to discover, and this is such an important point you make early on out all right, because what we sometimes hear from from, you know, mid market advisors, yes, listed companies are not relevant for my work, right? Yeah, I only, I only look at transaction items. I mean, of course, we also provide you with transaction might present but we’ll get there in a few minutes. But we think that every additional data point is relevant, right? And even though it’s not directly comparable, the you know, the large global corporations, after you factor in a discount the small company discount the liquidity discount, whatever you want to call it, it just adds another data point in your analysis where then increases the value of your of your valuation. Alright. Very good point. Well, and of course, you in any case, you need the beta factors, right from the large global listed companies, right? You can’t calculate beta factors from from smaller, smaller transactions. One thing to notice that these discounts that they just mentioned can also be overwritten, right. So if you have your own model for you know, a small company discount and you want to use this, you can override everything. So everything is built in a modular way, so you can change stuff. Good. Yeah. And then a few more options here. Show Details. sobhita calculation, just an example. I mean, obviously, we give you all the background calculations here, this case, the beater calculation, and the regression analysis and what goes into the, you know, the data. So that’s definitely also super relevant for you. But what I would also like to show you is, this year show more like this, if you click Show More like this, it will produce a list of companies that are similar to the one you’ve just looked at. So that’s very helpful. Because once you have a peer group, you can then you know, drill down further into certain directions, right? You find a company that you really like. And then you look at companies that are similar to the one you’ve just looked at, right? And you remove some others from your paper, right? And so then key group definition becomes this iterative process, and very intuitive. Okay, I will jump to the next step. And that’s financial projections that I think we should speed up a little bit here. And there now that you remind me if I forget something in my presentation, please. Okay, so financial projections, two options here. But litical estimates is one option. If you don’t have you know, financial forecasts, for example, right? If you are doing a valuation outside in, right, are you representing somebody on the buy side, and you only have a teaser with, you know, only a handful of numbers. But neuticle estimates can really help you build a good valuation a good outside in valuation, right. Keep in mind, you can also upload a financial model. But for now, I want to show you the validity for estimates. So what you see here is basically an overview of the most important financial metrics of a company sales, EBITDA, and so on here from the p&l and capex from the cash flow statement, and then working capital positions and others from the balance sheet. And what’s interesting is that, even though we only provided one number, if you remember 1 billion in revenues, that’s the number you see here, the system has now pre populated everything else. So it’s assuming growth rates here, it is assuming margins, and a certain margin development, and everything else, right. Now, how does the system do this? Right, we don’t have a crystal ball, we can’t look into the future. That’s true. We can’t look into the future for our company here. But what analysts do for the peer group is that they look into the future for the people, right, they built projections. And I want to quickly show you this on the benchmarking tab here. So here, again, you see our peer group. And you see the historic growth rates. But you also see these forecasts here, sales in this case, it’s the sales forecast, growth numbers. And what the system does is it is here is it looks at analyst forecasts, you know, you have these analysts sitting in banks, usually in research houses, and they build financial models for these companies. And they project the future. And what we do is basically, if we don’t know it, we just take the the median growth rate here, and we use this for our company, because we’re basically saying, yes, these large global companies, they’re not directly comparable. But anything that influences their growth rates, their margins should also influence our company’s growth rates and margins. And so with that information about sales profits, or, for example, the EBIT EBIT margins here, we can then build this entire table. And everything that’s green is a forecast based on peers, whereas everything that’s black or gray is basically an extrapolation. So for example, if we just extract extrapolating dates, the sales outstanding to forecast the accounts receivable.
Now, of course, you can override all of this, right, so I could just put in my own numbers, whether this is an absolute number or a relative number, you can just put everything in here, and just build your own forecast. So if you need to do something quickly, this is the way to do it. There is of course, also the option to upload your financials. So in the vast majority of cases, you will build your own financial model, right, you need the flexibility. To build your own operating model, you need the flexibility of a spreadsheet, right. And for these cases, you can open the importer. And you can download the model template work with the model template, I won’t show this now it will be a bit too much for here. And then just drag and drop it here. And you will we will read the data of that model incivility form. And that doesn’t just work with a model template that even works with your very own model templates, or even your clients templates. Just a few small things you need to prepare in your model and then you can read it automatically and beautiful. Is this a feature you guys are using at Zach’s? Oh,
Leonardo Pansardi Grisotto
yeah, that a lot. We have our own model. And we, we we do the export tab to input here in the system and compare against the periods and other things. So
Paul Resch
big time saver. Yeah. That’s right. Well, you’d be surprised so many of our clients, you know, they they’re not even using it right. And so Whenever I show this, they’re always fascinated, because it really does save a lot of time. Yeah. Good. Obviously, you can change a few things here, you can run different scenarios. In this case, we only have a PA case, but you could, you know, create an upside case, the downside case management case by case seller case, you name it. And then some more options here, I won’t go into too much detail, but we give you a few more plausibility checks for your valuation, you can make sure your forecasts are plausible. But I will now proceed to the next step. And that’s transactions. So just like with the peer group, what the system does here, again, is it’s trying to find peers, right? For the company we’re valuing. And here, it’s now decided to do a bit of a pan European approach in machinery, not necessary, and not necessary, I think we could probably get enough peers just by looking in Germany or not sorry, not peers, but comparable transactions, presidential elections. But again, it’s also making a suggestion here, you know, you always see the buyer, you see the target, you see the country and the sub industry, the stake that was acquired and the deal value. And then we also show you the different multiples, right. And now, just like with the peer group, at the end, we calculate the median of all of all the above transactions, we also show you the median here, by the way for machinery overall. So all companies in machinery global, so you have an additional data point to benchmark against. And of course, just like with the peer group, you can refine this, this this list. So here, for example, 1.69, either Dad, it’s probably not a very good one. Normally, what you would do is you would eliminate outliers. What I really like to do is do a search here filter, and do a full text search because he can become really specific, right? I mean, of course, you can just search for machinery. But that would be easier, you can just do the industry search here 3600 industry as machinery deals. So have a look at what Germany has to offer 255 deals in Germany in machinery, that we could, for example, limit this to the last three years, six transactions. And now we can, you know, just just add these deals here very quickly to our list of transactions.
Leonardo Pansardi Grisotto
How many transactions can you add
Paul Resch
to this table? It’s in theory, it’s unlimited. Just keep in mind, when you export everything to PowerPoint, it can mess up your formatting a little bit. But it’s unlimited. One thing, by the way, we are planning to do is to have different tiers of peers, but also have transactions, right? So you have a tier one, tier two, tier three, and then you can do the st you can then switch between the different tiers and see what the effect is. Excellent. Practice. Yeah. Well, and just like with the PS, you could also apply a discount or median here, we’re not proposing anything, because it really depends on you know, the type of fields you have selected here above, right, if you only had 17 billion citizen citizen cope elevator deals, you would probably want to include the discount. In this case, I’ve just decided to remove this outlier transaction and instead focused on the smaller deal I mean, they’re still big right but bit smaller deals to arrive at our valuation multiples for transactions Okay, anything to add anything I forgot Leonardo,
Leonardo Pansardi Grisotto
when a thing is worth dimension is when you have this this kind of table transactions and peer groups easily like that. So, we you, you start putting your analyst or if you are an analyst, you you start using your time more wisely, instead of wasting time searching the whole internet to gather all those data, which lots of times are very hard to to have. So you start really analyzing the deals, analyzing the segments, understanding the drivers behind it, the drivers that move this industry, so you jump from a very operational work to a more strategically and more qualified work. So you stop wasting your time with things that does not add to your client from from their point of view and to start bringing qualitative information insights from the industry. Sometimes when we have this kind of table here for example, trends privately held companies with the multiples right over there. We show them this Wow, I’ve never seen that before. And you’re right, this, this, this, this companies are quite similar to mine. And so we set the expectations. For example, one client of ours, were expecting two times sales. So we said you were wrong. And we proved how he was wrong by showing this right table here. So that transaction, the market is not paying two times sales is paying off 150 125 times the overall market that funds the investors are paying that. So you, as I said, you jump from very operational and data work at your more strategic and insightful work.
Paul Resch
Yep. And I think ultimately, the kind of work that your client likes to pay for, right. Nobody likes to pay for, you know, cost of capital analysis for three days.
Leonardo Pansardi Grisotto
Exactly.
Paul Resch
Yeah. In the meantime, I’ve done a little another little poll. Thank you for contributing here. super interesting results. Leonardo. Can you also see the results as a panelist? Yeah, okay, fantastic. So how long does it typically valuation take to complete in terms of hours? Well, it’s not really ours. I guess I’d stays here to correct this. But yeah, interesting, right. So anything that between one to two days to more than seven days, right? So there is some wide variation there. I assume it’s because we have some political users and some non political users here on the in the audience. Now, but it just proves that, you know, valuation work is takes a long time, right? That’s why it’s also paid well, I guess. Good. Okay. With this, let’s jump to the most exciting part, because now we go to the actual valuation. Until now, all we’ve done was really collected some inputs for our valuation right. Next step is now where it all comes together. So what the system does now is it’s using all these inputs, it’s performing cost of capital analysis, it’s running. Well, as you can see here, it’s almost too quick enough, I have a new computer everything so fast. But it’s then also showing all the results in one nice overview chart. We used to call this a football field chart. So what you see here at the top are the four different DCF based methods that we have, we have five actually one mistake here. Yeah, but if I look at this, they’re suggesting a valuation of let’s say, well, eight, nine, maybe 100,000, maybe a million right. Further down here, we see trading comparables. And here, by the way, I haven’t even explained like the blue range here for the DCF based methods is based on a sensitivity analysis, you already see we’re changing the terminal growth rate, and we’re changing the whack, right. And that’s how you get the sensitivities. In the midpoint you get the green dots. For the trading comparables, it’s a bit different. Here, the blue bar, the blue range here shows a range around where the peers are trading. And if you remember, we entered the discount to where the peers are, what the PSR 29% discount. So that’s where the green.is to the left here, of that range. And then further down, we have transaction comparables. That’s a typical, that’s typically what you see right here, you have control premiums, these are typically higher than the trading comps, some outliers here to the north, some outliers to the south. And then finally, also a leveraged buyout analysis 22 times entry exit, probably a bit aggressive. So if I see this, I will probably override this. I see 18 times here, well plausible eight to eight times here 11 times, why don’t we change this to maybe a 15, that’s probably still get. So as you can see, I can directly make some changes here, and everything will update in real time. It’s also something very nice. If you want to do this kind of analysis with your clients, you can immediately show them what the effects are of, you know, changes here to your parameters. Rest looks fine. system also, by the way, proposal proposes a range here in light blue, I think that range is probably a bit too wide. But we can narrow that down further. Once we’ve chosen the methods we want to show. Here we’re bridging the gap between enterprise value and equity value, you can make adjustments to the net debt, when in the process. Finally, some more pension obligations are found or whatever it is, this is where you can enter this stuff. And it will update the equity value. And in a very nice graphical way of showing the web calculation here. So in this part here, we see that the capital asset pricing model, mostly the various different adjustments we’re making. That’s all green basically is the cost So that could be part of this, this tree of this branch, and a cost of debt is in dark blue here. And then everything below is really that the side calculations. So I don’t wanna go into too much detail, but every valuation method has one box here one one piece of paper. So we tried to make it very intuitive and multiples. See one outlier here, that cue tech, he, we probably should have excluded that one. So mom, it was either EBIT, mitogens, price earnings, all the different activities you would expect for the trading comps. Then here the transaction costs. Not too many contributors here for for PE, for example, I could just hide this method there. If I hide it here. If I also hide this one, what you see at the top is that these methods are now disappearing, right? So we only see two multiples left. Very useful, right? Because you always have one or two methods that are outliers. And in this way, you can, you know, you can hide those outliers.
Right, I’ve already showed how to adjust the parameters. One last thing I want to show you here before we close this demo is the exports because this is really everybody’s favorite feature. Because it’s so quick, and it really replaces the most annoying part of the work. So why don’t we export into the indicative valuation report in English, I just hit the Export button. And what the system does now is and this this might take a few minutes, because it’s depending on how many people are working on it. This is now generating a full valuation reports on the browser. Maybe while we wait for that, let me start another poll. There are you have you built your own report? So are you using mostly the existing reports we offer?
Leonardo Pansardi Grisotto
We have our own report, but we are using some parts of the report that vertical exports to us. In our report, for example, the whack whack table that that graph is is is very elegant and very, very easy to explain to our clients. So we use that in a full
Paul Resch
shot. Yep. What you could explore is also the the the option to build your own templates. Not many people are using this yet. But it’s well see, the download has just started. Maybe I’ll show you the PowerPoint first. One thing after another. So this, I think I have to share my screen again and share the PowerPoints. So this is what this looks like here. Just very quickly. Typical exports, everything you saw earlier on the screen. Now, in a presentation, you know, you can edit stuff, you can you know, change the descriptions, you can change everything right, this is just really a PowerPoint presentation. nicely formatted, you know, best practice 37 pages in this case, you can use either in its entirety, or individual slides, like a an atom. So this is how this works. Yep, thank you. And then very quickly, I pointed out that there’s also an option to design your own template, you can do this by clicking on the plus button, and then download our template, edit the template to really make it match your needs your design, if you have your own company design, we upload it and then political will export into this template. Unfortunately, it’s only possible in words I had in PowerPoint doesn’t work with page break and a few other things. But, you know, we even had clients who could be very creative and use the landscape word and rebuild the PowerPoint this way. So it’s it’s incredible. Yeah, two people come up with Okay. Now I’m glad to share the results of the poll. A full 63% think it’s very important to improve the valuation processes, and a 30 and further 38% think it’s important. No one thinks no one’s neutral and topic and nobody thinks it’s not important at all. So that’s very good. So everybody who contribute to that with an either very important or important, please speak to us. We’d like to show you a bit more about the cuticle and and what it could what it could do for you. Good. That concludes our little presentation of the platform 45 minutes just like we promised an hour Do we have anything anything open anything we haven’t discussed, or that you would like to add?
Leonardo Pansardi Grisotto
Well I think We covered most part of the important points and relevant features of the the system that we use here.
Paul Resch
Agree, I? So we have one question from the audience, he had a question, you can just put it in the chat or in the q&a. Or if you want, I think we can also give you speaking rights here. I haven’t tried that yet. Either you decide. Let’s give him a few seconds. Any other questions? Please? Let us know. Okay, if you value in a not public health company, can you feed the information in the system? Yes, well, it depends on what kind of information you’re talking about. But for what you can do, for example, is you can upload your own transaction multiples. So if you have, you know, everybody has worked on transactions that are not public, but maybe you know, you want to reuse that data, you can, of course, upload that in political and you will be able to use that API factory. That’s a great example. I hope everybody’s following the chat here. Yeah, I mean, look, there. First of all, for beer factories, beer distributors, there are a large number of public peers, and also a large number of transactions. There was a big wave of consolidation in the industry A few years ago, I happen to work on one project there even and, and a lot of that is public, because these companies, you know, in depth, and they can you name it, they’re all huge companies, they usually report report their their transactions. So yeah, you should definitely be able to value a beer factory even pops, by the way, once I’ve done a valuation for a pop, I thought this is impossible. There is a lot of data out there on pops, especially in the UK. Thank you any quick question? Okay. There are no further questions.
Leonardo Pansardi Grisotto
One thing I remembered here, we were discussing these days, our own model, and we were talking about market base discount rates. So if we had to use US market databases, or Brazil’s databases or download that, and Professor demo data, databases, so what we’re going to use to, to input to serve as an inputs for our own model. So we stopped discussing that and we moved to vertical and that party you showed from market based data. And we started from using directly from there and stop chatting and discussing about what will be the best measure? And because because it’s all there, all the good metrics from Capital IQ, which is one of the the best databases in the world. So we started discussing this, the thing, this kind of things and starting, as I said, analyzing the module.
Paul Resch
Great. And I think that’s exactly the plan. I think we reached our goal, right? Because we want you to think about, you know, as you said, the strategic things, right? Leave the number crunching to us. Because you can rely on our numbers and our models. I think that’s, it’s great to hear. Excellent. Well, Your Honor, it’s been a pleasure. Thank you for for joining us today. great having you here. I look forward to working together with you.
Leonardo Pansardi Grisotto
All right. Thank you.
Paul Resch
To the audience. Thank you very much for tuning in today. And please speak to us if you’re interested. Thank you very much.